Tracking Model Metrics: Your AI's Report Card 📊
Want to keep track of how well your model is performing? Let's explore how to log and visualize your model's metrics in Dataloop!
Getting Started 🚀
💡 Pro Tip: All models from our marketplace automatically track metrics. This guide is for custom models!
What You'll Need 📋
- A Dataloop Package Kit (
dl.DPK) - A Model with a dataset ID (
dl.Model)
Setting Up Your Metrics Dashboard 🎯
First, let's create our tracking environment:
import dtlpy as dl
import os
import numpy as np

# Connect to your project
project = dl.projects.get(project_name='your-awesome-project')

# Publish your DPK and install the app
dpk = project.dpks.publish()
app = project.apps.install(dpk=dpk)

# Create a model to track
model = app.models.create(
    model_name='My Tracked Model',
    dpk_model_name='model-name-from-dpk',
    description='A model with awesome metrics tracking',
    dataset_id='your-dataset-id',
    labels=[]
)
Logging Your Metrics 📈
Let's add some training metrics! Here's a simple example tracking training progress:
# Simulate training metrics
epochs = np.linspace(0, 9, 10)
accuracies = np.array([0.82, 0.85, 0.87, 0.89, 0.90, 0.91, 0.92, 0.93, 0.94, 0.95])
losses = np.array([0.5, 0.4, 0.35, 0.3, 0.25, 0.23, 0.2, 0.18, 0.15, 0.13])

# Log accuracy metrics
print("📊 Logging accuracy metrics...")
for epoch, accuracy in zip(epochs, accuracies):
    model.metrics.create(
        samples=dl.PlotSample(
            figure='Training Metrics',
            legend='Model Accuracy',
            x=epoch,
            y=accuracy
        ),
        dataset_id=model.dataset_id
    )

# Log loss metrics
print("📉 Logging loss metrics...")
for epoch, loss in zip(epochs, losses):
    model.metrics.create(
        samples=dl.PlotSample(
            figure='Training Metrics',
            legend='Training Loss',
            x=epoch,
            y=loss
        ),
        dataset_id=model.dataset_id
    )

print("✨ Metrics logged successfully!")
Your metrics will appear in your model's "Metrics" tab, looking something like this:
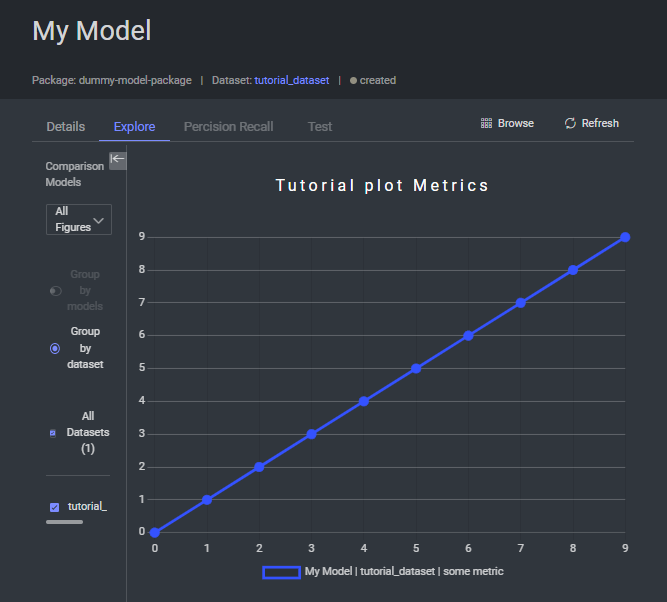
🎯 Pro Tip: Compare different training runs by selecting multiple metrics in the sidebar!
Analyzing Your Metrics 📊
Want to dig into your metrics programmatically? Here's how:
# List all metrics
print("🔍 Fetching metrics...")
metrics = model.metrics.list()

# Method 1: Iterate through samples
print("\n📊 Individual Metrics:")
for sample in metrics.all():
    print(f"Epoch {sample.x}: {sample.y:.3f}")

# Method 2: Convert to DataFrame
print("\n📈 Metrics DataFrame:")
df = metrics.to_df()
print(df.head())
Best Practices for Metrics Tracking 👑
Organization 📋
- Use consistent metric names
- Group related metrics together
- Add clear legends and labels
Tracking Strategy 🎯
- Log metrics at regular intervals
- Include both training and validation metrics
- Track multiple performance indicators
Visualization 📊
- Use appropriate plot types
- Include units when relevant
- Keep plots clean and readable
Pro Tips 💡
Real-time Monitoring ⚡
# Log metrics during training
for epoch in range(num_epochs):
    # Your training loop
    model.metrics.create(
        samples=dl.PlotSample(
            figure='Live Training',
            legend='Accuracy',
            x=epoch,
            y=current_accuracy
        ),
        dataset_id=model.dataset_id
    )
Custom Metrics 🎨
# Log multiple metrics types
model.metrics.create(
    samples=[
        dl.PlotSample(figure='Performance', legend='Precision', x=epoch, y=precision),
        dl.PlotSample(figure='Performance', legend='Recall', x=epoch, y=recall),
        dl.PlotSample(figure='Performance', legend='F1', x=epoch, y=f1_score)
    ],
    dataset_id=model.dataset_id
)
Happy tracking! 📈